Learn to trade with Japanese candlesticks - trend reversal patterns

Previously we looked into how different candlesticks might look. Now, as we all know, or should know, the best time to buy cryptocurrency is just after a trend reversal. But how to spot potential trend reversal indications on a candlestick chart? That's where candlestick patterns come into play. Candlestick reversal patterns can consist of just one candlestick or up to six candlesticks.
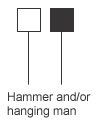
Hammer and Hanging Man patterns
Hammer is a pattern with a small body, no upper shadow but long lower shadow, and occurs in a downtrend. Hanging man is exactly the same and occurs in the uptrend. The smaller the body is and the longer the long lower shadow is, the better signal it makes. Hanging man (occurring during an uptrend) with an empty body is considered more bearish than with filled body and Hammer (occurring during an downtrend) with filled body more bullish.
After you see this pattern in the chart, it's a good idea to wait and see if the next period will open higher (in case of Hammer) or lower (in case of Hanging man) to get some sort of confirmation to the reversal. It's also a good sign if during the Hammer/Hanging man pattern you also see increased trading volume. Additionally, in case of Hanging man the body should be at the upper end of the general trading range, and the shadow should be at least two times the size of the body.
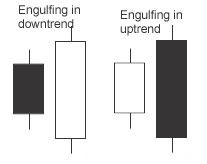
Engulfing pattern
Engulfing pattern consists of two candlesticks, one filled, one empty. The second body is engulfing the first body like you can see on the image below. Shadows don't matter here. This pattern is a sign of a trend reversal. The first candlestick's color (green/red or filled/blank) should reflect the previous trend. The bigger the second candlestick's engulfing is, the better signal it is. Also, this pattern is more reliable when it appears close to the support or resistance line.
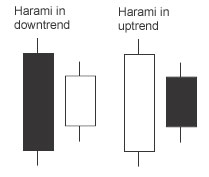
Harami
It looks the opposite to Engulfing. See the image below. You can remember the looks by remembering that Harami means pregnant in old Japanese language.
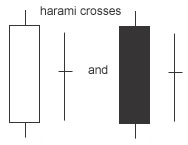
Harami Cross
Harami Cross has a big body which followed by a small body with long shadows (think of long-legged doji, the Rickshaw man) that is within the previous candlestick's body. It is considered a reversal pattern ONLY IF there haven't been too many Doji's during the past periods.
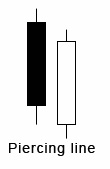
Piercing Line
Bullish reversal pattern occurring in a downtrending market. The first candlestick is filled (bearish) and the second empty (bullish). The second candlestick should open below the first candlestick's low and close above the midpoint of previous candlestick's body. Both candlesticks should be long days and the requirements just mentioned should be followed by the letter for this to be considered a piercing line.
Dark Cloud Cover
Being the exact opposite to Piercing line, Dark Cloud Cover is a bearish reversal pattern.
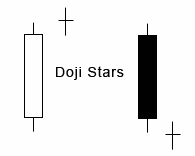
Doji Star
Doji star can give us a heads up about a possible trend change. Long body followed by a really short body (Doji) that is in the direction of the current trend.
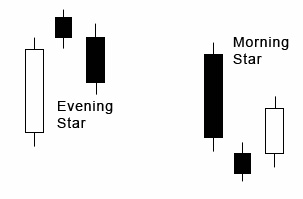
Morning Star and Evening Star
Morning Star is a bullish reversal pattern - long filled body followed by small body (and a gap between them), followed by a long empty body. It's a good sign if there's a gap both after and before the middle body. First body should be according to the previous trend. Note that in case of the second body it is not so important whether it is filled or empty. Evening Star is the opposite of the Morning Star.
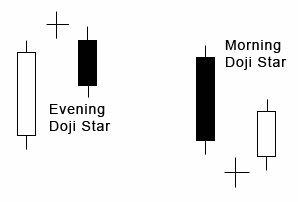
Morning and Evening Doji Stars
Almost like Morning Star and Evening Star, but the middle body is a Doji.
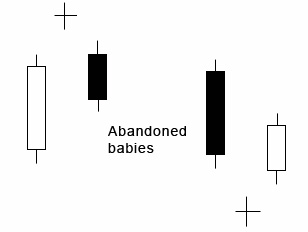
Abandoned baby
No, you shouldn't abandon your baby, but that's the official name of this candlestick. This is again similar to Morning/Even ing Doji's but the middle candlestick should be further away from the surrounding candlesticks, and have a gap even from the shadows of the other two bodies.
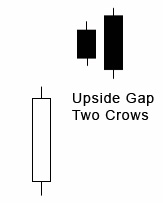
Upside Gap Two Crows
A very bearish pattern. First candlestick should be empty, followed by a gap, and then two filled candlesticks, the last candlestick should open higher and close lower than the middle candlestick.
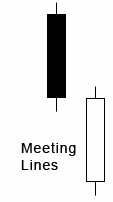
Meeting Lines
Two long candlesticks, first bullish, second bearish, or opposite, both have the same closing price.
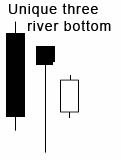
Unique Three River Bottom
Unique pattern that can't be seen often. But if you do see it, you can consider it a great signal. Works both on bearish and bullish trends.
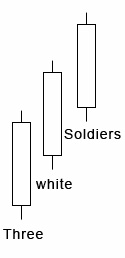
Three white soldiers & Three Black Crows
Three white soldiers is made up of three long candlesticks that close higher every day. In a perfet world the prices would open in the middle of the previous candlestick's body. The shadows shouldn't be too long. Three white soldiers occurs in downtrend and is a sign that the trend will now reverse to bullish. Three Black Crows is exactly the opposite pattern.
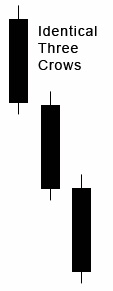
Identical Three Crows
Similar to the three black crows pattern with one difference - each body opens exactly or almost exactly at the previous body's close. This pattern occurs in uptrend.
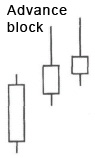
Advance Block
Similar to the three white soldiers. BUT this pattern occurs in uptrend and it looks a bit different. Each candlestick need to close a bit higher than the previous candlestick and open within the previous candlestick's body, the shadows on the second and third day should be quite long while each body should be smaller than the previous one.
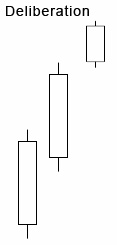
Deliberation
Similar again to the three white soldiers but the third soldier has a smaller body and shorter shadows, and there's a gap with to the second soldier. Occures in an uptrend and is a sign of a possible bearish reversal. Note that the market usually "deliberates" during 2-4 candles following a pattern trying to decide which way to go.
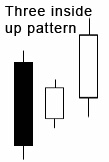
Three inside up pattern (and three inside down pattern)
It's the confirmation you need for the Harami pattern. First two candlesticks form the Harami, and the third one confirms it. The third candlestick should be closing higher than the first body.
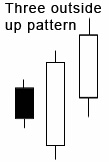
Three outside up pattern (and three outside down pattern)
This is the confirmation for the Engulfing pattern.
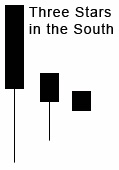
Three Stars in the South
Occuring in a downtrend, each next day has a smaller body. The long and then a bit shorter shadows on the first two bodies are very important, considering they show signs of buying interest.
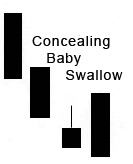
Concealing Baby Swallow
Occures in downtrend, predicting bullish move. Appears very rarely.
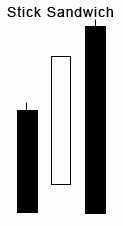
Stick Sandwich
Stick Sandwich is made up of three candlesticks, the first body as well as the third is filled and have the same closing and the middle one should be empty. Occurs during a downtrend and around 62% of the time it's a sign of a bearish continuation pattern.
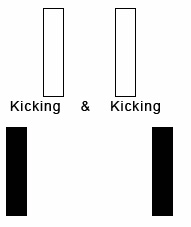
Kicking
One empty and one filled body with a gap between them, no shadows at all. Second body indicates the direction the price might start to move now.
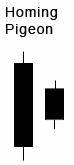
Homing Pigeon
Same as Harami except that both bodies are black. Bullish reversal pattern occuring in a downtrend.
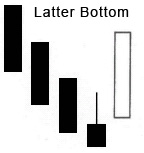
Latter Bottom
Occurs in downtrend, bullish pattern.
Matching Low
Two candlestick, both filled and with equal closing prices and mainly with only upper shadows or just very small lower shadows. Second body smaller but with longer upper shadow.
Which patterns work the best is anyone's guess, but it has been said that Three Black Crows, Three White Soldiers, Three Inside Up, Three Outside Down, Dark Cloud Cover, and Three Outside Up, might be some of the best ones.
Why are gaps important?
Having gaps between two candlesticks in a bear market means that the opening price is higher than the previous body's/candlestick's trading range.
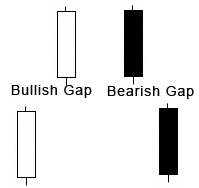
Gaps are great to spotting possible trend reversals. If you use the gaps to buy at the bottom, it might be good idea to set your stop loss limits to the open area of the previous candlestick. The gap in the top is called an Exhaustion Gap.
Hammer and Hanging Man patterns
Hammer is a pattern with a small body, no upper shadow but long lower shadow, and occurs in a downtrend. Hanging man is exactly the same and occurs in the uptrend. The smaller the body is and the longer the long lower shadow is, the better signal it makes. Hanging man (occurring during an uptrend) with an empty body is considered more bearish than with filled body and Hammer (occurring during an downtrend) with filled body more bullish.
After you see this pattern in the chart, it's a good idea to wait and see if the next period will open higher (in case of Hammer) or lower (in case of Hanging man) to get some sort of confirmation to the reversal. It's also a good sign if during the Hammer/Hanging man pattern you also see increased trading volume. Additionally, in case of Hanging man the body should be at the upper end of the general trading range, and the shadow should be at least two times the size of the body.
Engulfing pattern
Engulfing pattern consists of two candlesticks, one filled, one empty. The second body is engulfing the first body like you can see on the image below. Shadows don't matter here. This pattern is a sign of a trend reversal. The first candlestick's color (green/red or filled/blank) should reflect the previous trend. The bigger the second candlestick's engulfing is, the better signal it is. Also, this pattern is more reliable when it appears close to the support or resistance line.
Harami
It looks the opposite to Engulfing. See the image below. You can remember the looks by remembering that Harami means pregnant in old Japanese language.
Harami Cross
Harami Cross has a big body which followed by a small body with long shadows (think of long-legged doji, the Rickshaw man) that is within the previous candlestick's body. It is considered a reversal pattern ONLY IF there haven't been too many Doji's during the past periods.
Piercing Line
Bullish reversal pattern occurring in a downtrending market. The first candlestick is filled (bearish) and the second empty (bullish). The second candlestick should open below the first candlestick's low and close above the midpoint of previous candlestick's body. Both candlesticks should be long days and the requirements just mentioned should be followed by the letter for this to be considered a piercing line.
Dark Cloud Cover
Being the exact opposite to Piercing line, Dark Cloud Cover is a bearish reversal pattern.
Doji Star
Doji star can give us a heads up about a possible trend change. Long body followed by a really short body (Doji) that is in the direction of the current trend.
Morning Star and Evening Star
Morning Star is a bullish reversal pattern - long filled body followed by small body (and a gap between them), followed by a long empty body. It's a good sign if there's a gap both after and before the middle body. First body should be according to the previous trend. Note that in case of the second body it is not so important whether it is filled or empty. Evening Star is the opposite of the Morning Star.
Morning and Evening Doji Stars
Almost like Morning Star and Evening Star, but the middle body is a Doji.
Abandoned baby
No, you shouldn't abandon your baby, but that's the official name of this candlestick. This is again similar to Morning/Even ing Doji's but the middle candlestick should be further away from the surrounding candlesticks, and have a gap even from the shadows of the other two bodies.
Upside Gap Two Crows
A very bearish pattern. First candlestick should be empty, followed by a gap, and then two filled candlesticks, the last candlestick should open higher and close lower than the middle candlestick.
Meeting Lines
Two long candlesticks, first bullish, second bearish, or opposite, both have the same closing price.
Unique Three River Bottom
Unique pattern that can't be seen often. But if you do see it, you can consider it a great signal. Works both on bearish and bullish trends.
Three white soldiers & Three Black Crows
Three white soldiers is made up of three long candlesticks that close higher every day. In a perfet world the prices would open in the middle of the previous candlestick's body. The shadows shouldn't be too long. Three white soldiers occurs in downtrend and is a sign that the trend will now reverse to bullish. Three Black Crows is exactly the opposite pattern.
Identical Three Crows
Similar to the three black crows pattern with one difference - each body opens exactly or almost exactly at the previous body's close. This pattern occurs in uptrend.
Advance Block
Similar to the three white soldiers. BUT this pattern occurs in uptrend and it looks a bit different. Each candlestick need to close a bit higher than the previous candlestick and open within the previous candlestick's body, the shadows on the second and third day should be quite long while each body should be smaller than the previous one.
Deliberation
Similar again to the three white soldiers but the third soldier has a smaller body and shorter shadows, and there's a gap with to the second soldier. Occures in an uptrend and is a sign of a possible bearish reversal. Note that the market usually "deliberates" during 2-4 candles following a pattern trying to decide which way to go.
Three inside up pattern (and three inside down pattern)
It's the confirmation you need for the Harami pattern. First two candlesticks form the Harami, and the third one confirms it. The third candlestick should be closing higher than the first body.
Three outside up pattern (and three outside down pattern)
This is the confirmation for the Engulfing pattern.
Three Stars in the South
Occuring in a downtrend, each next day has a smaller body. The long and then a bit shorter shadows on the first two bodies are very important, considering they show signs of buying interest.
Concealing Baby Swallow
Occures in downtrend, predicting bullish move. Appears very rarely.
Stick Sandwich
Stick Sandwich is made up of three candlesticks, the first body as well as the third is filled and have the same closing and the middle one should be empty. Occurs during a downtrend and around 62% of the time it's a sign of a bearish continuation pattern.
Kicking
One empty and one filled body with a gap between them, no shadows at all. Second body indicates the direction the price might start to move now.
Homing Pigeon
Same as Harami except that both bodies are black. Bullish reversal pattern occuring in a downtrend.
Latter Bottom
Occurs in downtrend, bullish pattern.
Matching Low
Two candlestick, both filled and with equal closing prices and mainly with only upper shadows or just very small lower shadows. Second body smaller but with longer upper shadow.
Which patterns work the best is anyone's guess, but it has been said that Three Black Crows, Three White Soldiers, Three Inside Up, Three Outside Down, Dark Cloud Cover, and Three Outside Up, might be some of the best ones.
Why are gaps important?
Having gaps between two candlesticks in a bear market means that the opening price is higher than the previous body's/candlestick's trading range.
Gaps are great to spotting possible trend reversals. If you use the gaps to buy at the bottom, it might be good idea to set your stop loss limits to the open area of the previous candlestick. The gap in the top is called an Exhaustion Gap.
more in learn
Trading cryptocurrencies - introduction to Japanese candlesticks
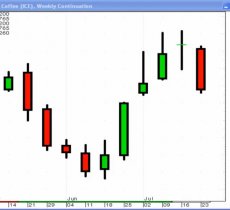
A candlestick chart looks a bit different from a normal chart with just a line with opening or closing prices on it. And compared to a usual high-low chart Japanese Candlesticks chart can make it easier to see certain patterns in the market and see data relationships.
A candlestick chart looks a bit different from a normal chart with just a line with opening or closing prices on it. And compared to a usual high-low chart Japanese Candlesticks chart can make it easier to see certain patterns in the market and see data relationships.
Good Indicators for trading crypto currencies
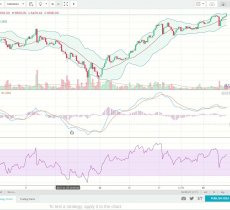
Assuming you've installed Metatrader and signed up a demo account with some trading company that supports Metatrader, which indicators should you start testing? And how to use those indicators for trading cryptocurrencies? Or should you be using any indicators at all?
Assuming you've installed Metatrader and signed up a demo account with some trading company that supports Metatrader, which indicators should you start testing? And how to use those indicators for trading cryptocurrencies? Or should you be using any indicators at all?
Let's talk about automated trading bots and compounding
There are different kinds of automated crypto trading bots out there. In this post I'll mainly talk not about the bots which simply trade your crypto based on certain trading signals, but bots that are mainly hyip.
There are different kinds of automated crypto trading bots out there. In this post I'll mainly talk not about the bots which simply trade your crypto based on certain trading signals, but bots that are mainly hyip.
Learn to trade cryptocurrencies
How can you trade cryptocurrencies with Metatrader? What indicators should you use when trading cryptocurrencies? And much more. Lets start trading crypto for real!
How can you trade cryptocurrencies with Metatrader? What indicators should you use when trading cryptocurrencies? And much more. Lets start trading crypto for real!
Learn Angular, Angular for dummies, free AngularJS course for dummies - your first project

Learn Angular with me while I learn it. This is sort of a Angular for dummies crash course, free AngularJS course for dummies.
Learn Angular with me while I learn it. This is sort of a Angular for dummies crash course, free AngularJS course for dummies.
  |