Good Indicators for trading crypto currencies
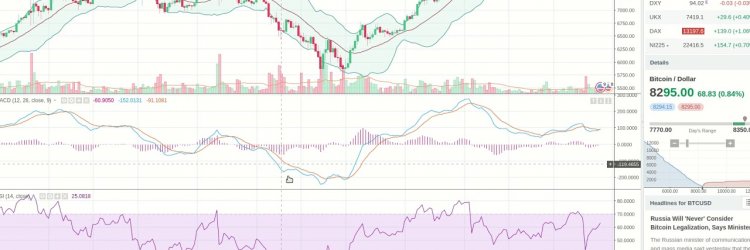
Assuming you've installed Metatrader and signed up a demo account with some trading company that supports Metatrader, which indicators should you start testing? And how to use those indicators for trading cryptocurrencies? Or should you be using any indicators at all?
Obviously, in general, it's all up to you. Indicators are in essence manipulations of price or volume data and not necessary for profitable trading, but sometimes they can make things easier, and make the chart easier to read sometimes.
It has been suggested that if you do use indicators, you should only use one indicator from each of the four groups (Oscillators, Volume, Overlays, Breadth Indicators), although you could use more than one Overlay to better see trend changes, trade levels as well as areas of potential support or resistance.
It's a good indicator to help you spot trends. It can also help sift through the noise of price fluctuations. "A moving average is a continuously calculated value of the arithmetic mean of the price over a specified time period." How can you make your trading decisions based on MA? The easiest way is to look at the MA line and compare it with the current price. If the price moves above the moving avergage, it's a bullish signal, or if the price falls below the moving average, it's a bearish signal. Note though that the price often crosses the moving average without any new trend starting.
MACD is based on exponential moving average (EMA) and is used to help determining exit and trading points. And it can be used both for trend and momentum following. MACD indicator oscillates between below and above the center line. If the MACD line is above the centerline it's a good idea to buy, if it's below it's a good idea to sell, and if it is just touching the line, a trend reversal can be imminent.
RSI is used to identify the speed of price movement by comparing recent closing prices, it can also be used to make price predictions. RSI ranges is 0 to 100. Values above 70 means the crypto is overbought (so the price is likely to go down) while RSI below 30 means the crypto is oversold (so the price is likely to go up). It could be considered something like Bollinger Bands, but goes a bit further by showing you whether or when the market reversal is going to be.
It is a Volatility Measure indicator showing the size of the moves on average over a given time frame. It is designed to keep traders in a trend and help traders to prevent an early exit. Usually the Chandelier Exit should be above prices during a downtrend and below prices during an uptrend.
Bollinger Bands can be used to find areas of resistance and support, also find profitable trades, and confirm breakouts. It consists of three lines - upper band, lower band, and moving average in the middle. In case of high volatility in the market the distance between the bands widens. How to use Bollinger Bands? There are two main strategies, (1) Bollinger Squeeze and (2) Bollinger Band: Support and Resistance. (1) If the lower and upper bands tighten and make the centerline escape the bands, it means a significant movement, breakout, is about to occur. You should trade after the first breakout has occured. If the breakout is above the top line, you should buy, and if it's below the bottom line should sell. (2) Ppper part of the Bollinger Band is the resistance while the lower part is the support. So you should sell at higher resistance and buy and lower support. This strategy should mainly be used when the bands are not too wide, as then the chance of breakout is low.
OBV is an indicator that takes the information about trading volume and makes it a simple indicator and can be used to confirm trends. The OBV should be rising when the price is rising and the OBV should be falling when the price is falling. However, if OBV is falling and the price is rising, chances are that the price might be near the top. Or if the OBV is rising and price is not rising, chances are that the price will be following OBV soon.
One could say it is Stochastic Oscillator on speed. Stochastic Oscillator is used to compare closing price to range of price over a given period of time. In general, if SMI falls below -40 and then rises above that level, you might want to buy. If it rises above 40 and falls below that level, you might want to sell. Of course, you should check other indicators as well to confirm. Another way to use SMI is to buy when it rises above its signal line and sell when SMI falls below the signal line.
VWAP is an intra-day calculation helping to see where a stock is trading compared to its weighted average for the day. VWAP is calculated by adding up the dollars traded for every transaction (price multiplied by number of shares traded) and then dividing by the total shares traded for the day. (source) It's good for assessing market direction and filtering trade signals. One way of using it is buying when the price is below VWAP and sell when the price is above VWAP. According to some opinions, the best time to buy a stock is when price crosses above VWAP and sell when the price crosses below VWAP.
Or rather, based on observations: Buy when red vwap line crosses the blue one and goes above it Sell when the red vwap crosses the blue one and goes below it. But obviously look for confirmations from candlestick patterns as well as other indicators.
Possibly an underestimated trend following system/technical indicator. ADX is based on the system of directional movement comparison of two different indicators - 14-period +DI one and the 14-period -DI. It is recommended to buy when +DI crosses above the -DI, and sell when -DI crosses above the +DI. To eliminate false signals, good entry point would be after you got the signal and then wait until the lines goes above the other one.
CCI movements mainly stay between -100 and +100. Any moves exceeding 100 show unusual strength while going under -100 shows weakness. Above +100 is considered a bullish signal, below -100 a bearish signal. At the same time it can also show that the crypto has been overbought (above 100) or oversold (below 100). Crossing the zero line can be considered a Bullish or Bearish divergence depending on which way it's going.
Parabolic SAR refers to a price-and-time-based trading system. It gives you the potential buy and sell signals (which should be confirmed by other indicators). If the dotted line moves from below to above price, you might want to sell and vice versa.
RVI is an indicator that measures the strength of a trend by comparing a security's closing price to its price range, and anticipates changes in market trends. The red line is called the "trigger line", as that's the line that provides trade signals when it crosses above or below the green line. If the red line goes below the green line it might be a good idea to buy. If the red line goes above the green line, it might be a good idea to sell.
(E)MAs on steroid? The Ichimoku Cloud, also known as Ichimoku Kinko Hyo, is a versatile indicator that defines support and resistance, identifies trend direction, gauges momentum and provides trading signals. (source). It helps you determine whether a tradable trend is present or if you should wait. Traders who use Ichimoku should look for buying entries when price is above the cloud. When the price is below the cloud you should look for selling signals.
That's one indicator I'm having problems understand myself too well. So I will personally leave it for now.
Now, keep in mind that I'm not a professional, I'm just sharing what I'm learning, and everything you do is at your own risk, of course.
Obviously, in general, it's all up to you. Indicators are in essence manipulations of price or volume data and not necessary for profitable trading, but sometimes they can make things easier, and make the chart easier to read sometimes.
It has been suggested that if you do use indicators, you should only use one indicator from each of the four groups (Oscillators, Volume, Overlays, Breadth Indicators), although you could use more than one Overlay to better see trend changes, trade levels as well as areas of potential support or resistance.
Moving Average
It's a good indicator to help you spot trends. It can also help sift through the noise of price fluctuations. "A moving average is a continuously calculated value of the arithmetic mean of the price over a specified time period." How can you make your trading decisions based on MA? The easiest way is to look at the MA line and compare it with the current price. If the price moves above the moving avergage, it's a bullish signal, or if the price falls below the moving average, it's a bearish signal. Note though that the price often crosses the moving average without any new trend starting.
MACD (Moving Average Convergence Divergence)
MACD is based on exponential moving average (EMA) and is used to help determining exit and trading points. And it can be used both for trend and momentum following. MACD indicator oscillates between below and above the center line. If the MACD line is above the centerline it's a good idea to buy, if it's below it's a good idea to sell, and if it is just touching the line, a trend reversal can be imminent.
RSI (Relative Strength Index)
RSI is used to identify the speed of price movement by comparing recent closing prices, it can also be used to make price predictions. RSI ranges is 0 to 100. Values above 70 means the crypto is overbought (so the price is likely to go down) while RSI below 30 means the crypto is oversold (so the price is likely to go up). It could be considered something like Bollinger Bands, but goes a bit further by showing you whether or when the market reversal is going to be.
ATR Stops (Chandelier Exits)
It is a Volatility Measure indicator showing the size of the moves on average over a given time frame. It is designed to keep traders in a trend and help traders to prevent an early exit. Usually the Chandelier Exit should be above prices during a downtrend and below prices during an uptrend.
Bollinger Bands
Bollinger Bands can be used to find areas of resistance and support, also find profitable trades, and confirm breakouts. It consists of three lines - upper band, lower band, and moving average in the middle. In case of high volatility in the market the distance between the bands widens. How to use Bollinger Bands? There are two main strategies, (1) Bollinger Squeeze and (2) Bollinger Band: Support and Resistance. (1) If the lower and upper bands tighten and make the centerline escape the bands, it means a significant movement, breakout, is about to occur. You should trade after the first breakout has occured. If the breakout is above the top line, you should buy, and if it's below the bottom line should sell. (2) Ppper part of the Bollinger Band is the resistance while the lower part is the support. So you should sell at higher resistance and buy and lower support. This strategy should mainly be used when the bands are not too wide, as then the chance of breakout is low.
On Balance Volume (OBV)
OBV is an indicator that takes the information about trading volume and makes it a simple indicator and can be used to confirm trends. The OBV should be rising when the price is rising and the OBV should be falling when the price is falling. However, if OBV is falling and the price is rising, chances are that the price might be near the top. Or if the OBV is rising and price is not rising, chances are that the price will be following OBV soon.
The Stochastic Momentum Index (SMI)
One could say it is Stochastic Oscillator on speed. Stochastic Oscillator is used to compare closing price to range of price over a given period of time. In general, if SMI falls below -40 and then rises above that level, you might want to buy. If it rises above 40 and falls below that level, you might want to sell. Of course, you should check other indicators as well to confirm. Another way to use SMI is to buy when it rises above its signal line and sell when SMI falls below the signal line.
VWAP (the volume weighted average price)
VWAP is an intra-day calculation helping to see where a stock is trading compared to its weighted average for the day. VWAP is calculated by adding up the dollars traded for every transaction (price multiplied by number of shares traded) and then dividing by the total shares traded for the day. (source) It's good for assessing market direction and filtering trade signals. One way of using it is buying when the price is below VWAP and sell when the price is above VWAP. According to some opinions, the best time to buy a stock is when price crosses above VWAP and sell when the price crosses below VWAP.
Or rather, based on observations: Buy when red vwap line crosses the blue one and goes above it Sell when the red vwap crosses the blue one and goes below it. But obviously look for confirmations from candlestick patterns as well as other indicators.
ADX (Average Directional Index)
Possibly an underestimated trend following system/technical indicator. ADX is based on the system of directional movement comparison of two different indicators - 14-period +DI one and the 14-period -DI. It is recommended to buy when +DI crosses above the -DI, and sell when -DI crosses above the +DI. To eliminate false signals, good entry point would be after you got the signal and then wait until the lines goes above the other one.
Commodity Channel Index (CCI)
CCI movements mainly stay between -100 and +100. Any moves exceeding 100 show unusual strength while going under -100 shows weakness. Above +100 is considered a bullish signal, below -100 a bearish signal. At the same time it can also show that the crypto has been overbought (above 100) or oversold (below 100). Crossing the zero line can be considered a Bullish or Bearish divergence depending on which way it's going.
Parabolic SAR
Parabolic SAR refers to a price-and-time-based trading system. It gives you the potential buy and sell signals (which should be confirmed by other indicators). If the dotted line moves from below to above price, you might want to sell and vice versa.
Relative Vigor Index - RVI
RVI is an indicator that measures the strength of a trend by comparing a security's closing price to its price range, and anticipates changes in market trends. The red line is called the "trigger line", as that's the line that provides trade signals when it crosses above or below the green line. If the red line goes below the green line it might be a good idea to buy. If the red line goes above the green line, it might be a good idea to sell.
Ichimoku Cloud
(E)MAs on steroid? The Ichimoku Cloud, also known as Ichimoku Kinko Hyo, is a versatile indicator that defines support and resistance, identifies trend direction, gauges momentum and provides trading signals. (source). It helps you determine whether a tradable trend is present or if you should wait. Traders who use Ichimoku should look for buying entries when price is above the cloud. When the price is below the cloud you should look for selling signals.
That's one indicator I'm having problems understand myself too well. So I will personally leave it for now.
Now, keep in mind that I'm not a professional, I'm just sharing what I'm learning, and everything you do is at your own risk, of course.
more in learn
Let's talk about automated trading bots and compounding
There are different kinds of automated crypto trading bots out there. In this post I'll mainly talk not about the bots which simply trade your crypto based on certain trading signals, but bots that are mainly hyip.

There are different kinds of automated crypto trading bots out there. In this post I'll mainly talk not about the bots which simply trade your crypto based on certain trading signals, but bots that are mainly hyip.
Learn to trade cryptocurrencies
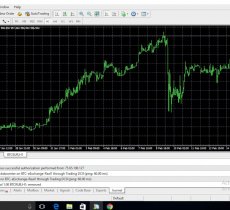
How can you trade cryptocurrencies with Metatrader? What indicators should you use when trading cryptocurrencies? And much more. Lets start trading crypto for real!

How can you trade cryptocurrencies with Metatrader? What indicators should you use when trading cryptocurrencies? And much more. Lets start trading crypto for real!
Learn Angular, Angular for dummies, free AngularJS course for dummies - your first project
Learn Angular with me while I learn it. This is sort of a Angular for dummies crash course, free AngularJS course for dummies.

Learn Angular with me while I learn it. This is sort of a Angular for dummies crash course, free AngularJS course for dummies.
Learn Angular, Angular for dummies, free AngularJS course for dummies - setting it up
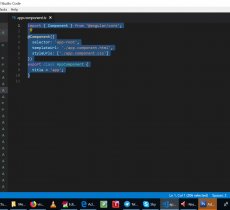
Angular at first glance, even if you know a web development language like PHP before, looks extremely confusion. I'm talking about my own experience.

Angular at first glance, even if you know a web development language like PHP before, looks extremely confusion. I'm talking about my own experience.
|
|

