Trading cryptocurrencies - introduction to Japanese candlesticks

A candlestick chart looks a bit different from a normal chart with just a line with opening or closing prices on it. And compared to a usual high-low chart Japanese Candlesticks chart can make it easier to see certain patterns in the market and see data relationships.
Learn the understand Japanese Candlesticks and how to trade with them
Here's how general Japanese candlesticks look like:
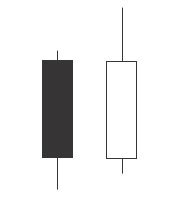
So a candlestick is a box, either filled with color, or empty. Filled box means the open price was higher than the close price, meaning during the box-period the price fell. If the box is empty, it means the open was lower than close and the price rose. The lines on top and below the box are the period's (the period can be a minute, hour, day, whatever, depending on the timeframe of your chart) high and low. These lines are called shadows. Note that on some charts you can also have filled as red and empty as green, just to make sure it wouldn't confuse you.
The candlesticks can vary in their looks, and they all have different meaning, here's a small explanation about different versions and the candlestick names.
Long Day candlestick - The candlestick has a long body and short shadow, meaning the open and close prices are quite far from each other. How long makes it a long one depends on what the usual in case of your crypto pair is on the chart. And if the candlestick is considerably longer than the usual it means it's a long day.
Short day candlestick - same as long day but oppsite, candlestick with a very short body, can be a box or smaller.
Paper umbrella (Karakasa) - candlestick with a long lower shadow and small body. Independent of whether it's a bearish or bullish candlestick (filled/blank), it shows that the bears were unable to keep prices down and could be an early sign of an ending bear market.
Maribozu candlestick - this candlestick has no visible shadows (the thin lines on the top and in the bottom). Maribozu is generally considered a weak line and often means a trend continuation, either bullish or bearish.
Opening Maribozu - filled candlestick with no upper shadow, meaning the the open price was the highest price during the period. Empty candlestick with no bottom shadow means the price never went below the opening price.
Closing Maribozu - filled candlestick with no lower shadow, meaning the closing price was lower than the opening price but the period's high was above the open. Empty candlestick with no upper shadow means the closing price is the highest of the period. Closing Maribozu is considered a stonger indicator.
Doji candlestick - candlestick with pretty much no body at all, so the open and close prices are pretty much the same. If short day candlestick has a small body, then this one is more of a horizontal line. Doji can indicate a change of trend. There are different Dojis - Gravestone Doji has no lower shadow either, making it a bearish indication. You could think of it like this - the price opens at x, a few bulls are trying to push the price up but there's no support at the higher level at all, so it closes again at the price level X. The opposite to Gravestone Doji is Dragonfly dodji. Dragonfly doji is an indication of a bull run. Four price doji is a doji when all prices are exactly the same - open close high low are equal - and it is just an horizontal line. And there is also long-legged doji (or Rickshaw man) - doji with long shadows. This candlestick shows there's indecision in the market.
Spinning tops candlesticks - these are candlesticks with small bodies (think of short day candlestick) but with shadows that are both longer than the body.
Stars - it occurs when there's a long body and then next to it there's a small body and the small body that starts from slightly above or a below the previous body.
Learn the understand Japanese Candlesticks and how to trade with them
Here's how general Japanese candlesticks look like:
So a candlestick is a box, either filled with color, or empty. Filled box means the open price was higher than the close price, meaning during the box-period the price fell. If the box is empty, it means the open was lower than close and the price rose. The lines on top and below the box are the period's (the period can be a minute, hour, day, whatever, depending on the timeframe of your chart) high and low. These lines are called shadows. Note that on some charts you can also have filled as red and empty as green, just to make sure it wouldn't confuse you.
The candlesticks can vary in their looks, and they all have different meaning, here's a small explanation about different versions and the candlestick names.
Long Day candlestick - The candlestick has a long body and short shadow, meaning the open and close prices are quite far from each other. How long makes it a long one depends on what the usual in case of your crypto pair is on the chart. And if the candlestick is considerably longer than the usual it means it's a long day.
Short day candlestick - same as long day but oppsite, candlestick with a very short body, can be a box or smaller.
Paper umbrella (Karakasa) - candlestick with a long lower shadow and small body. Independent of whether it's a bearish or bullish candlestick (filled/blank), it shows that the bears were unable to keep prices down and could be an early sign of an ending bear market.
Maribozu candlestick - this candlestick has no visible shadows (the thin lines on the top and in the bottom). Maribozu is generally considered a weak line and often means a trend continuation, either bullish or bearish.
Opening Maribozu - filled candlestick with no upper shadow, meaning the the open price was the highest price during the period. Empty candlestick with no bottom shadow means the price never went below the opening price.
Closing Maribozu - filled candlestick with no lower shadow, meaning the closing price was lower than the opening price but the period's high was above the open. Empty candlestick with no upper shadow means the closing price is the highest of the period. Closing Maribozu is considered a stonger indicator.
Doji candlestick - candlestick with pretty much no body at all, so the open and close prices are pretty much the same. If short day candlestick has a small body, then this one is more of a horizontal line. Doji can indicate a change of trend. There are different Dojis - Gravestone Doji has no lower shadow either, making it a bearish indication. You could think of it like this - the price opens at x, a few bulls are trying to push the price up but there's no support at the higher level at all, so it closes again at the price level X. The opposite to Gravestone Doji is Dragonfly dodji. Dragonfly doji is an indication of a bull run. Four price doji is a doji when all prices are exactly the same - open close high low are equal - and it is just an horizontal line. And there is also long-legged doji (or Rickshaw man) - doji with long shadows. This candlestick shows there's indecision in the market.
Spinning tops candlesticks - these are candlesticks with small bodies (think of short day candlestick) but with shadows that are both longer than the body.
Stars - it occurs when there's a long body and then next to it there's a small body and the small body that starts from slightly above or a below the previous body.
more in learn
Good Indicators for trading crypto currencies
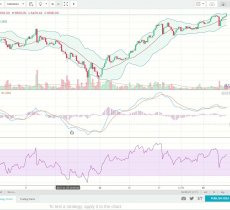
Assuming you've installed Metatrader and signed up a demo account with some trading company that supports Metatrader, which indicators should you start testing? And how to use those indicators for trading cryptocurrencies? Or should you be using any indicators at all?
Assuming you've installed Metatrader and signed up a demo account with some trading company that supports Metatrader, which indicators should you start testing? And how to use those indicators for trading cryptocurrencies? Or should you be using any indicators at all?
Let's talk about automated trading bots and compounding
There are different kinds of automated crypto trading bots out there. In this post I'll mainly talk not about the bots which simply trade your crypto based on certain trading signals, but bots that are mainly hyip.
There are different kinds of automated crypto trading bots out there. In this post I'll mainly talk not about the bots which simply trade your crypto based on certain trading signals, but bots that are mainly hyip.
Learn to trade cryptocurrencies
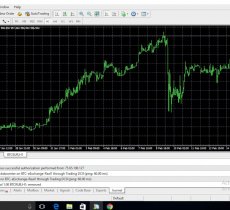
How can you trade cryptocurrencies with Metatrader? What indicators should you use when trading cryptocurrencies? And much more. Lets start trading crypto for real!
How can you trade cryptocurrencies with Metatrader? What indicators should you use when trading cryptocurrencies? And much more. Lets start trading crypto for real!
Learn Angular, Angular for dummies, free AngularJS course for dummies - your first project
Learn Angular with me while I learn it. This is sort of a Angular for dummies crash course, free AngularJS course for dummies.
Learn Angular with me while I learn it. This is sort of a Angular for dummies crash course, free AngularJS course for dummies.
Learn Angular, Angular for dummies, free AngularJS course for dummies - setting it up
Angular at first glance, even if you know a web development language like PHP before, looks extremely confusion. I'm talking about my own experience.
Angular at first glance, even if you know a web development language like PHP before, looks extremely confusion. I'm talking about my own experience.
  |